Statistics
Your decisions, in numbers.
Audit Logs tell you what happened in one execution. Statistics tell you what is happening across thousands of them. Pick any field from your input, output, or metadata and see it turned into a chart, a trend, a table.
Three clicks, not three weeks
Your audit data becomes a chart in three clicks: pick the rule, pick the date range, pick the field. No warehouse, no pipeline, no analyst waiting on a ticket.
Every field is a question you can ask
Approval rates, price bands, risk scores, execution times, error counts. If your rule touched the value, you can analyze it.
Answers, not just numbers
Every chart drills back down to the exact Audit Logs behind it. See the trend, then see the records that made it. The number always has a receipt.
Pick a Field See The Story
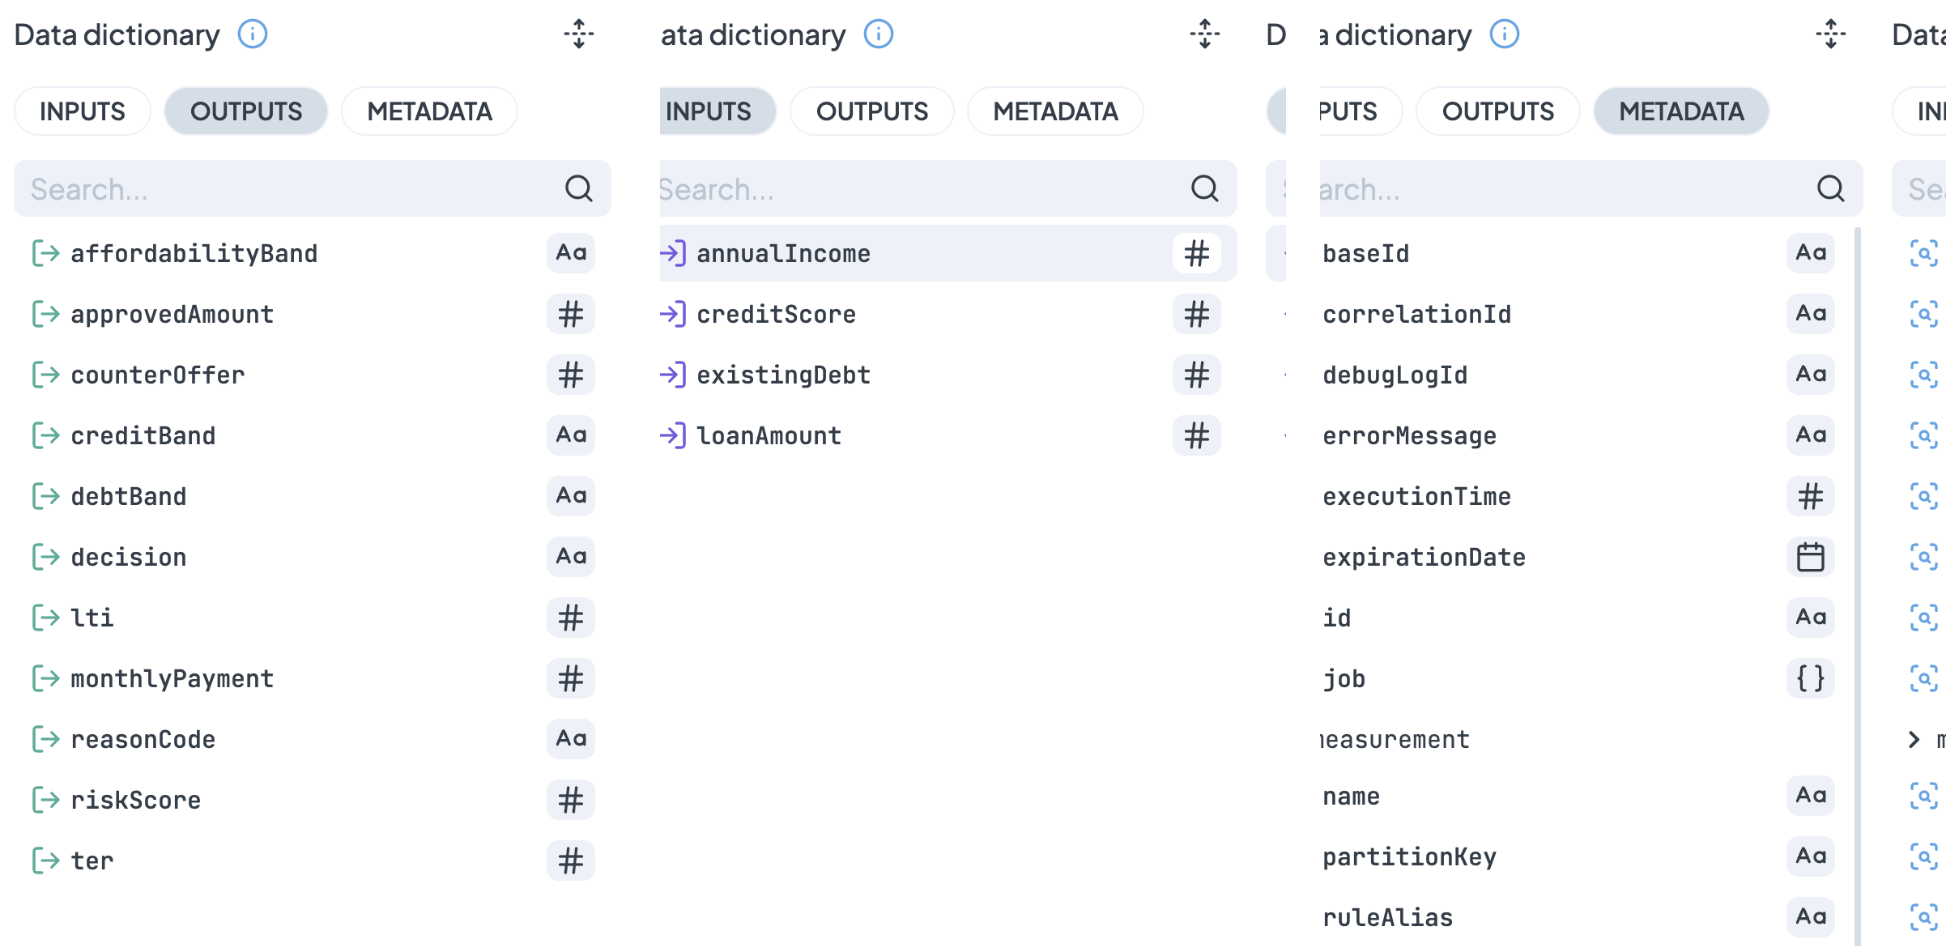
The Data Dictionary reads your Audit Logs and lists every attribute they contain, organized into Input, Output, and Metadata. Search for the one you care about, select it, and the analysis loads instantly.
- Input, output, and metadata attributes in one panel
- Types detected automatically from your own data
- Indicators showing which rules have data
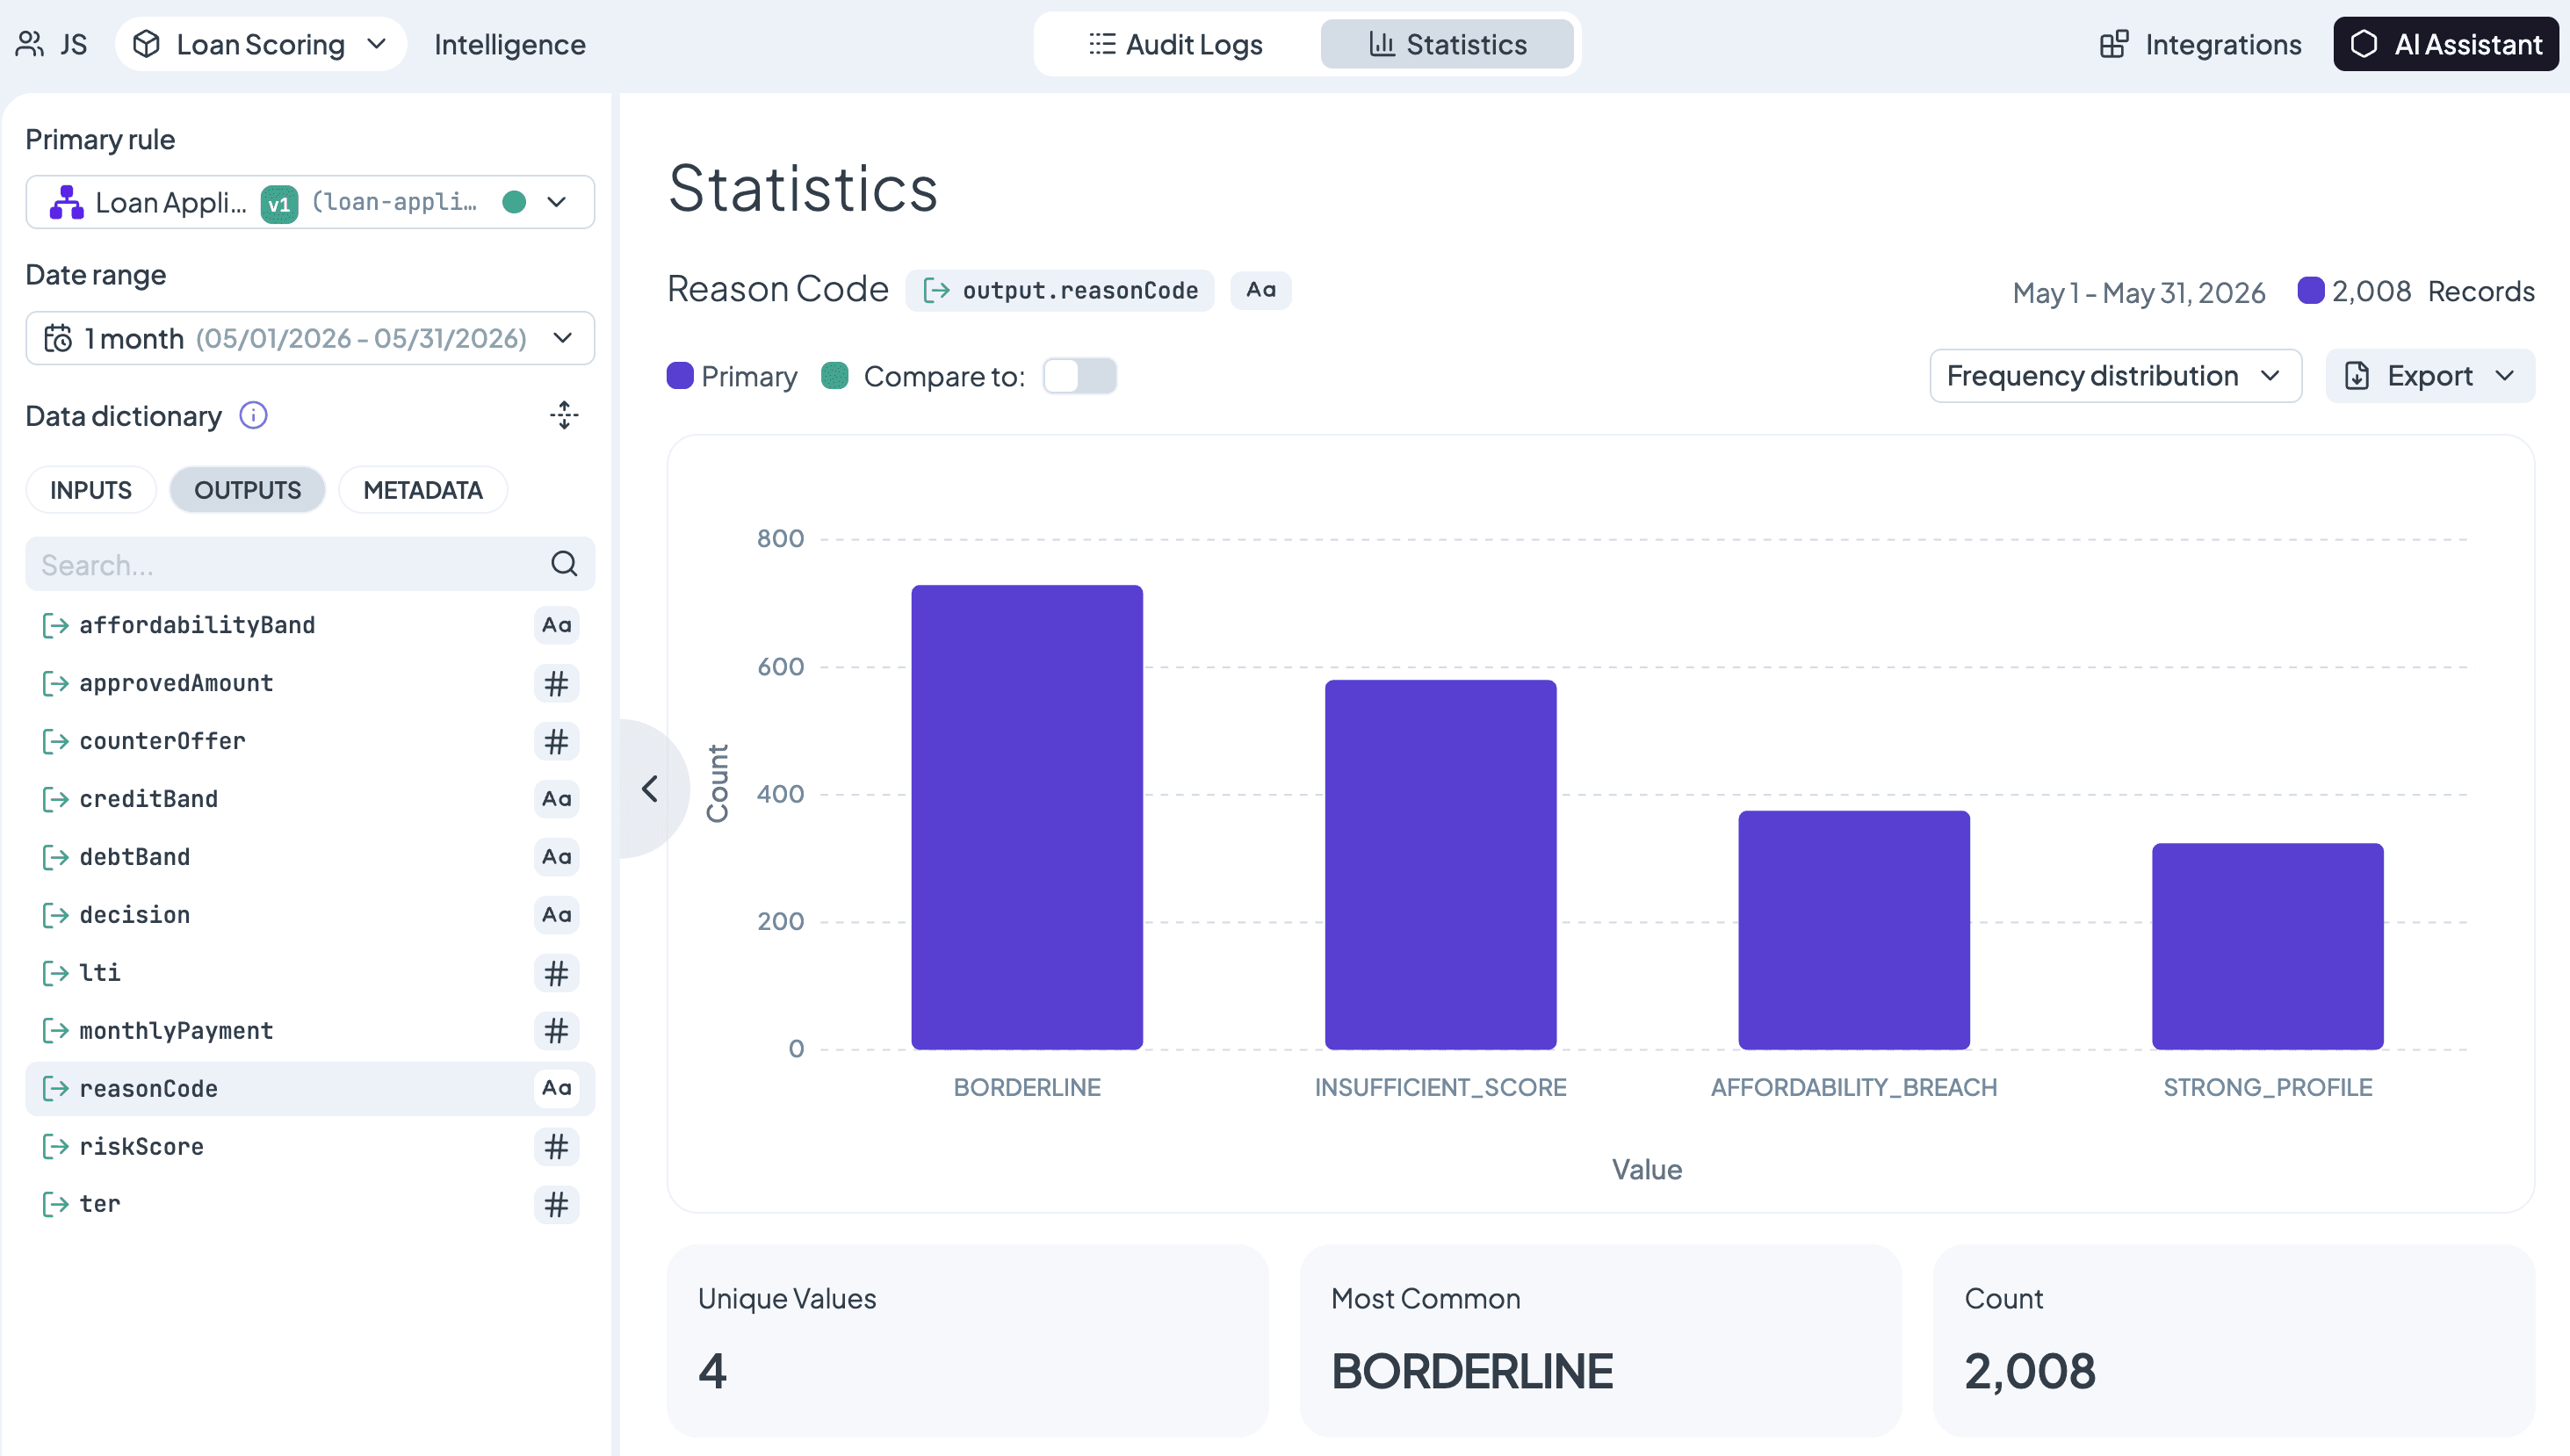
What Your Rules Actually Decide
Frequency Distribution counts how often each value appears. Which outcome fires most? Which segment dominates? Which value shows up that nobody expected? The composition of your decisions, at a glance.
- Distribution of decision outcomes, customer segments, status codes, users
- Spot outliers and unexpected values immediately
- Compare distributions across periods or datasets
Two Rules One View
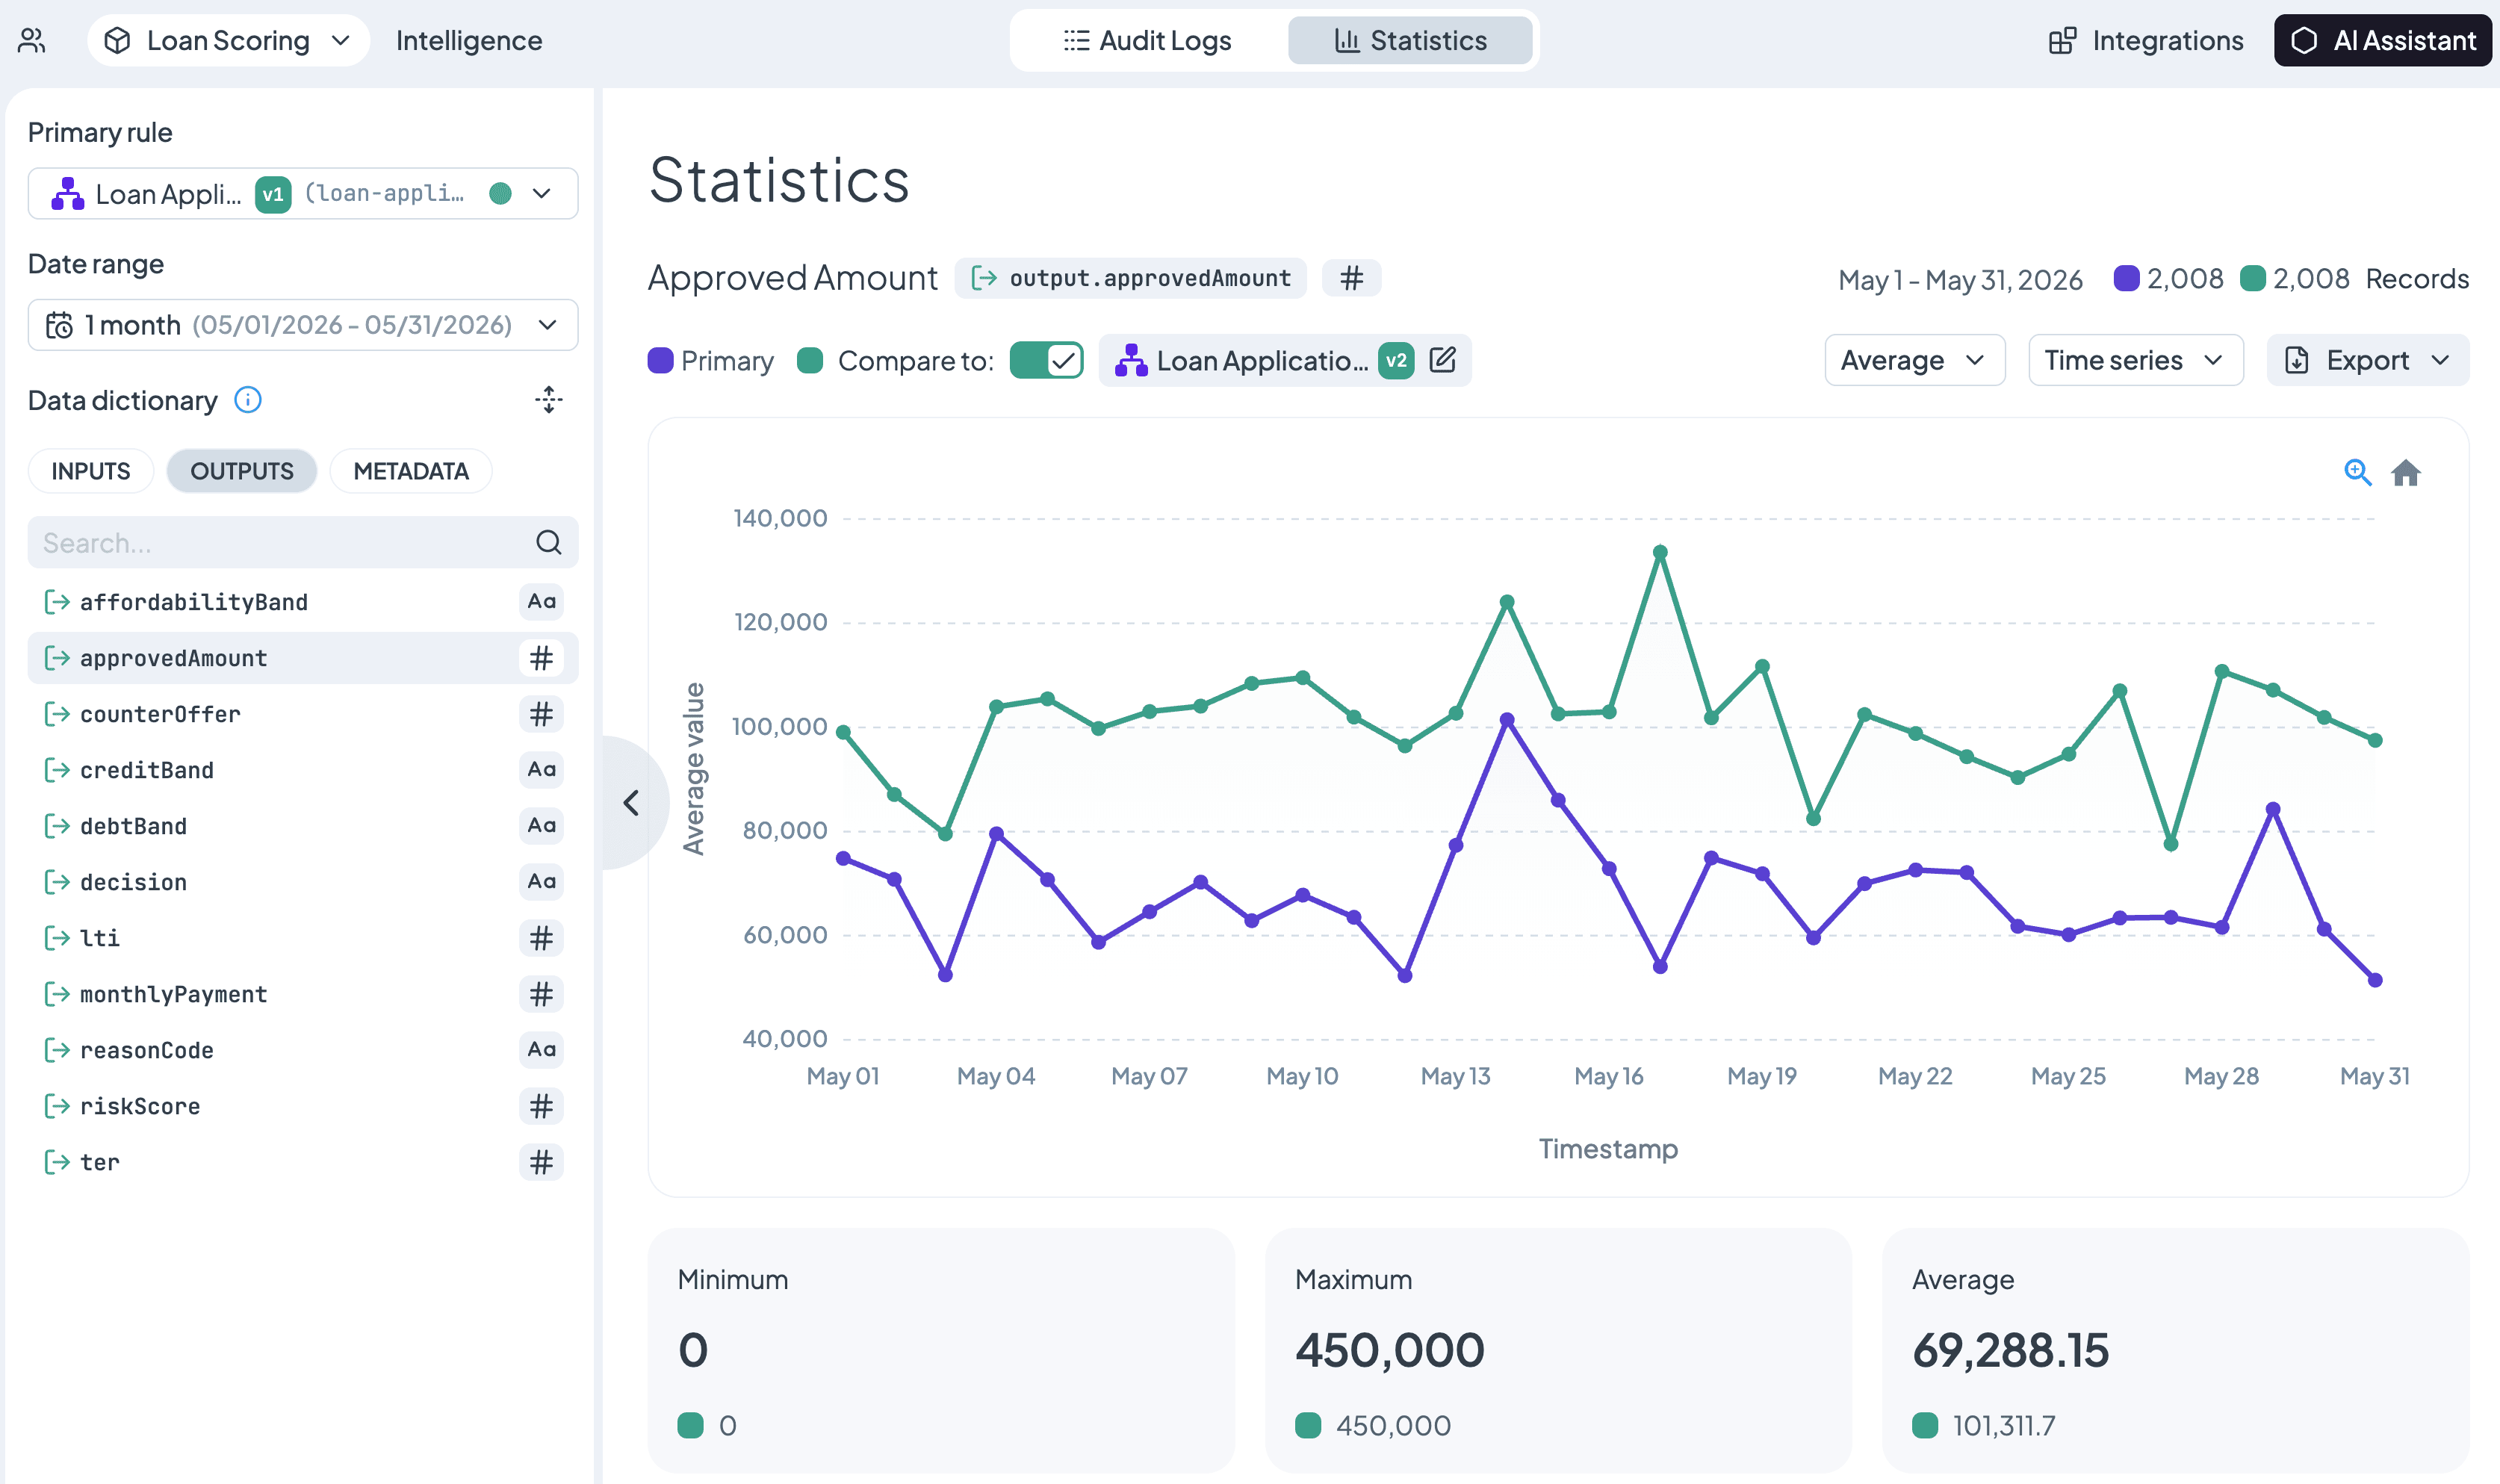
Turn on comparison, pick a second rule, and see both side by side. Compare a new version against the one it replaces.
- Side-by-side visualizations for two rules
- Independent date range for the secondary rule
- Shared attributes compared automatically
Take it with you
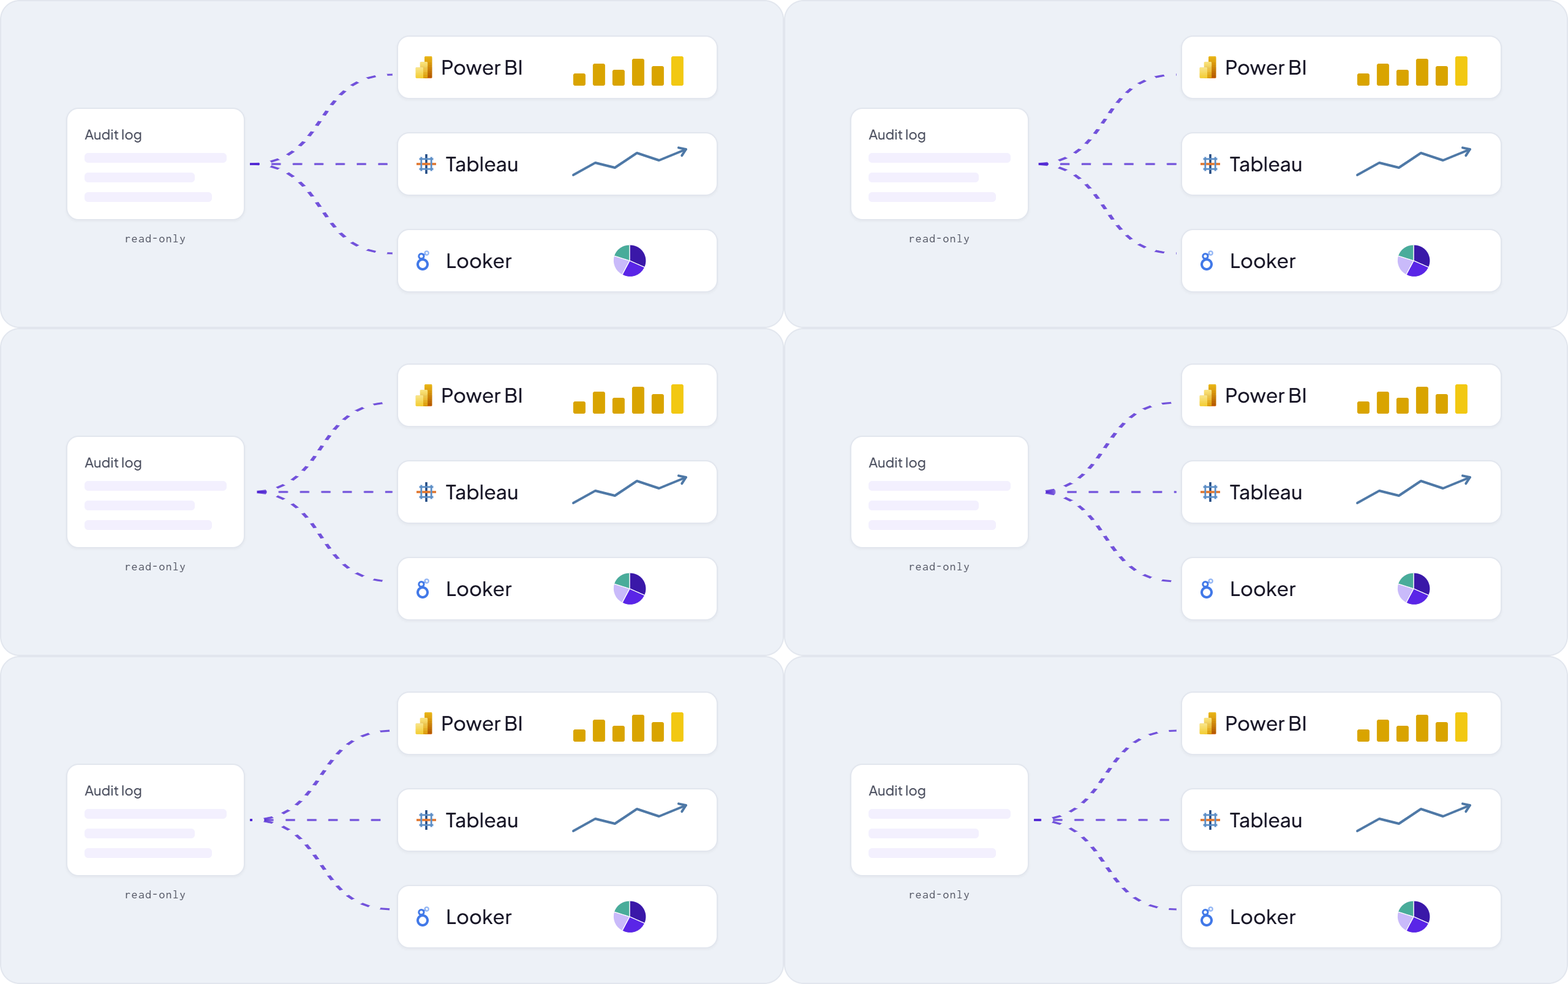
Export any view to CSV and keep working in the tools you already use. Need it in a dashboard instead? The Integrations panel generates ready-to-run REST API snippets and Power BI setup details using your own key, rules, and date range.
- Export Frequency Distribution, Time Series, and Raw Data Table to CSV
- Every export ships with a metadata file describing exactly what it contains
- Copy-paste integration snippets in cURL, JavaScript, Python, PHP, .NET, and Java
Frequently Asked Questions
Still have questions? We have answers.
Getting Started
How It Works
Import & Export
Best Practices
Try for Free
Experience DecisionRules at no cost. A credit card is not required for the trial.
Start for freeContact Sales
Have questions? Our sales team is here to help you find the best solution for your business.
contact sales